
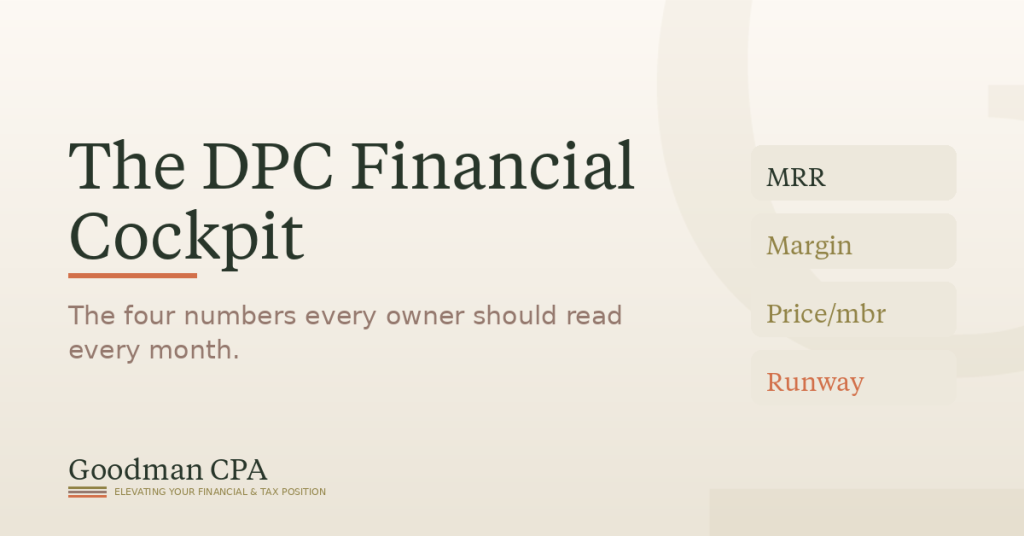
You didn’t leave the insurance system to spend your evenings squinting at spreadsheets. You left to practice medicine on your terms — and to build a business that holds up. The good news: running the financial side of a Direct Primary Care practice doesn’t require a finance degree. It requires four numbers, read the right way, once a month — in about the time it takes to see a new-patient visit.
We call it the Financial Cockpit. A pilot doesn’t watch every gauge; they watch the handful that show whether they’re climbing, level, or losing altitude. Your practice is the same. Master four instruments and you’ll know more about your business than most owners learn in a year — and you’ll walk into every decision, from a price increase to your first hire, already knowing the answer.
Instrument One: Monthly Recurring Revenue (MRR)
MRR is the heartbeat of a membership practice: the predictable, recurring revenue you can count on in a month — your active memberships at their current rates. Four hundred members at an average of $85 is $34,000 in MRR. It strips out the noise that a big enrollment week or a slow collection cycle creates in your bank account. Growing MRR means marketing and retention are working; flat MRR at a full panel is a signal it may be time to talk price; declining MRR is the earliest possible warning.
Instrument Two: Operating Margin
Operating margin is operating profit divided by revenue — of every dollar in, how much you keep. For DPC, 25–30% is normal and sustainable; 50% is achievable for a lean, mature solo practice. Margin dips during growth are normal: when you hire your first provider, margin compresses before it expands, because you’re spending ahead of the revenue that capacity will bring. Knowing that in advance turns a scary month into a planned one.
Instrument Three: Average Price Per Member
Total membership revenue divided by number of members reveals whether your pricing has kept pace with your value. Most owners anchored their price years ago and never revisited it, even as they added services and built waitlists. If your average has drifted well below what new members pay, you’re carrying the cost of your own loyalty — that’s information, and a modest, well-communicated adjustment across a full panel is the difference between a practice that funds a raise and one that quietly subsidizes it.
Instrument Four: Cash Runway
Cash runway is how many months you could operate if revenue stopped tomorrow — available cash divided by monthly operating expenses. $45,000 in the bank against $15,000 of monthly expenses is three months of runway. Three months, or about 10% of rolling annual revenue, is our baseline. It’s not a number that makes you money; it’s the number that lets you make good decisions — say no to a bad contract, weather a slow stretch, and hire before you’re desperate rather than after.
Why Your P&L Shows Profit but Your Bank Account Doesn’t
The most common thing we hear: “My P&L shows profit but my bank account’s unchanged — so did I really have a profit?” Profit and cash are two different questions. Your P&L measures whether the business earned more than it spent. But real cash leaves your account for things that never show as expenses: loan principal, money set aside for taxes, equipment bought outright, distributions you took to pay yourself. You can be genuinely profitable and watch your balance stay flat because that profit paid down debt or funded your reserve. It didn’t vanish — it changed form.
Reading the Whole Panel in 20 Minutes
The monthly ritual is short. Open your P&L. Check MRR and its direction. Calculate operating margin and note where you are in your growth cycle. Glance at average price per member. Confirm your runway. Then reconcile one question: did profit and cash move together, and if not, where did the difference go? Twenty minutes, once a month, and you’re flying the plane instead of hoping it lands itself.
This is the discipline behind the results across our client base — more than $22 million in documented tax savings, about $27,000 per practice per year. Those numbers don’t come from a magic deduction; they come from owners who finally understood their own financials well enough to act.
See the Cockpit Live — and Get Your Own Numbers Read
On August 20 we’re hosting a free webinar, The DPC Financial Cockpit — a live walkthrough of these four instruments built for Hint-powered practices. If you’ve ever stared at a monthly report and thought “now what,” this is the session that fixes it. And if you’d rather have someone read your actual gauges with you, book a free Tax Strategy Session — we’ll open your real financials and show you the specific moves waiting in your own numbers.